Electrochemical Oxidation / Engineering & System Design / Operational Cost Modeling
Modeling the True Operating Cost of an EO System
A defensible cost model needs electricity, electrode amortization, and chemicals on the same $/m3 basis — and a sensitivity analysis that shows which assumption actually moves the number.
Why This Matters
Every electrochemical oxidation proposal eventually gets reduced to a single number: cost per cubic meter treated. Getting that number right, and being able to defend it against scrutiny, means building it from the same three components every time — electricity, electrode amortization, and chemicals — rather than quoting a headline figure from a different application with different water chemistry.
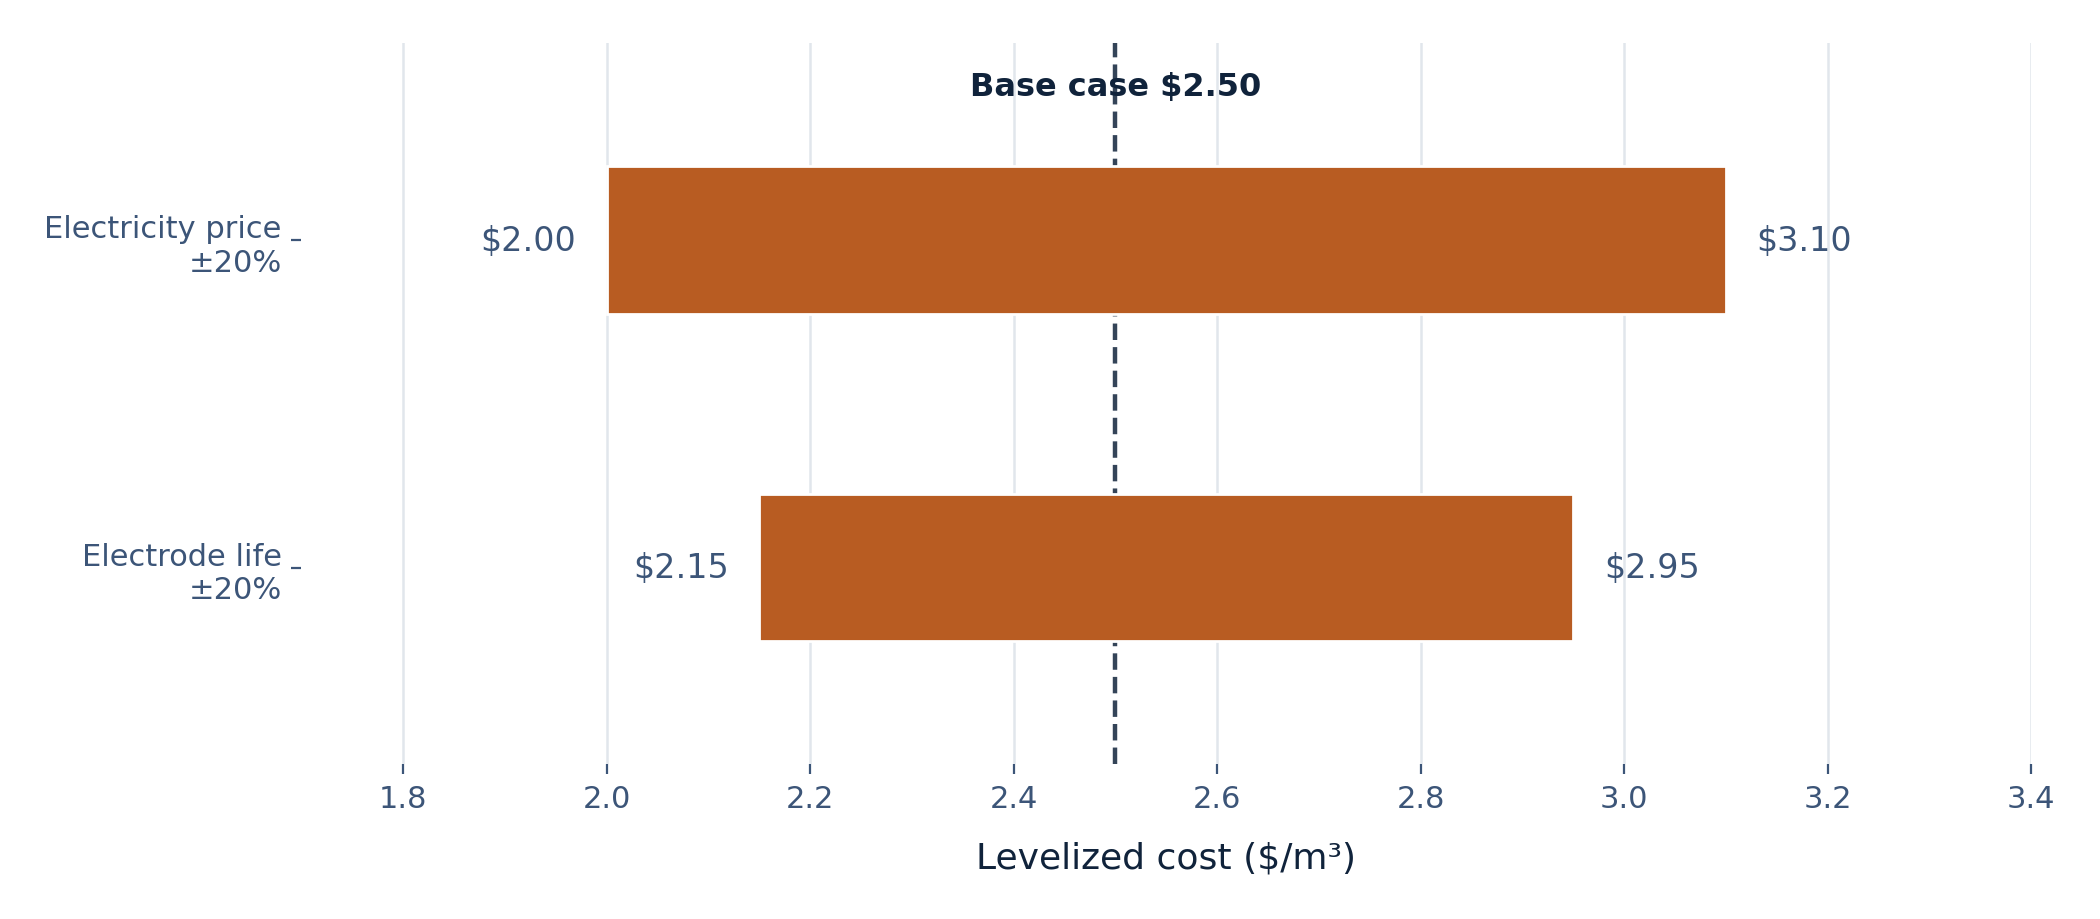
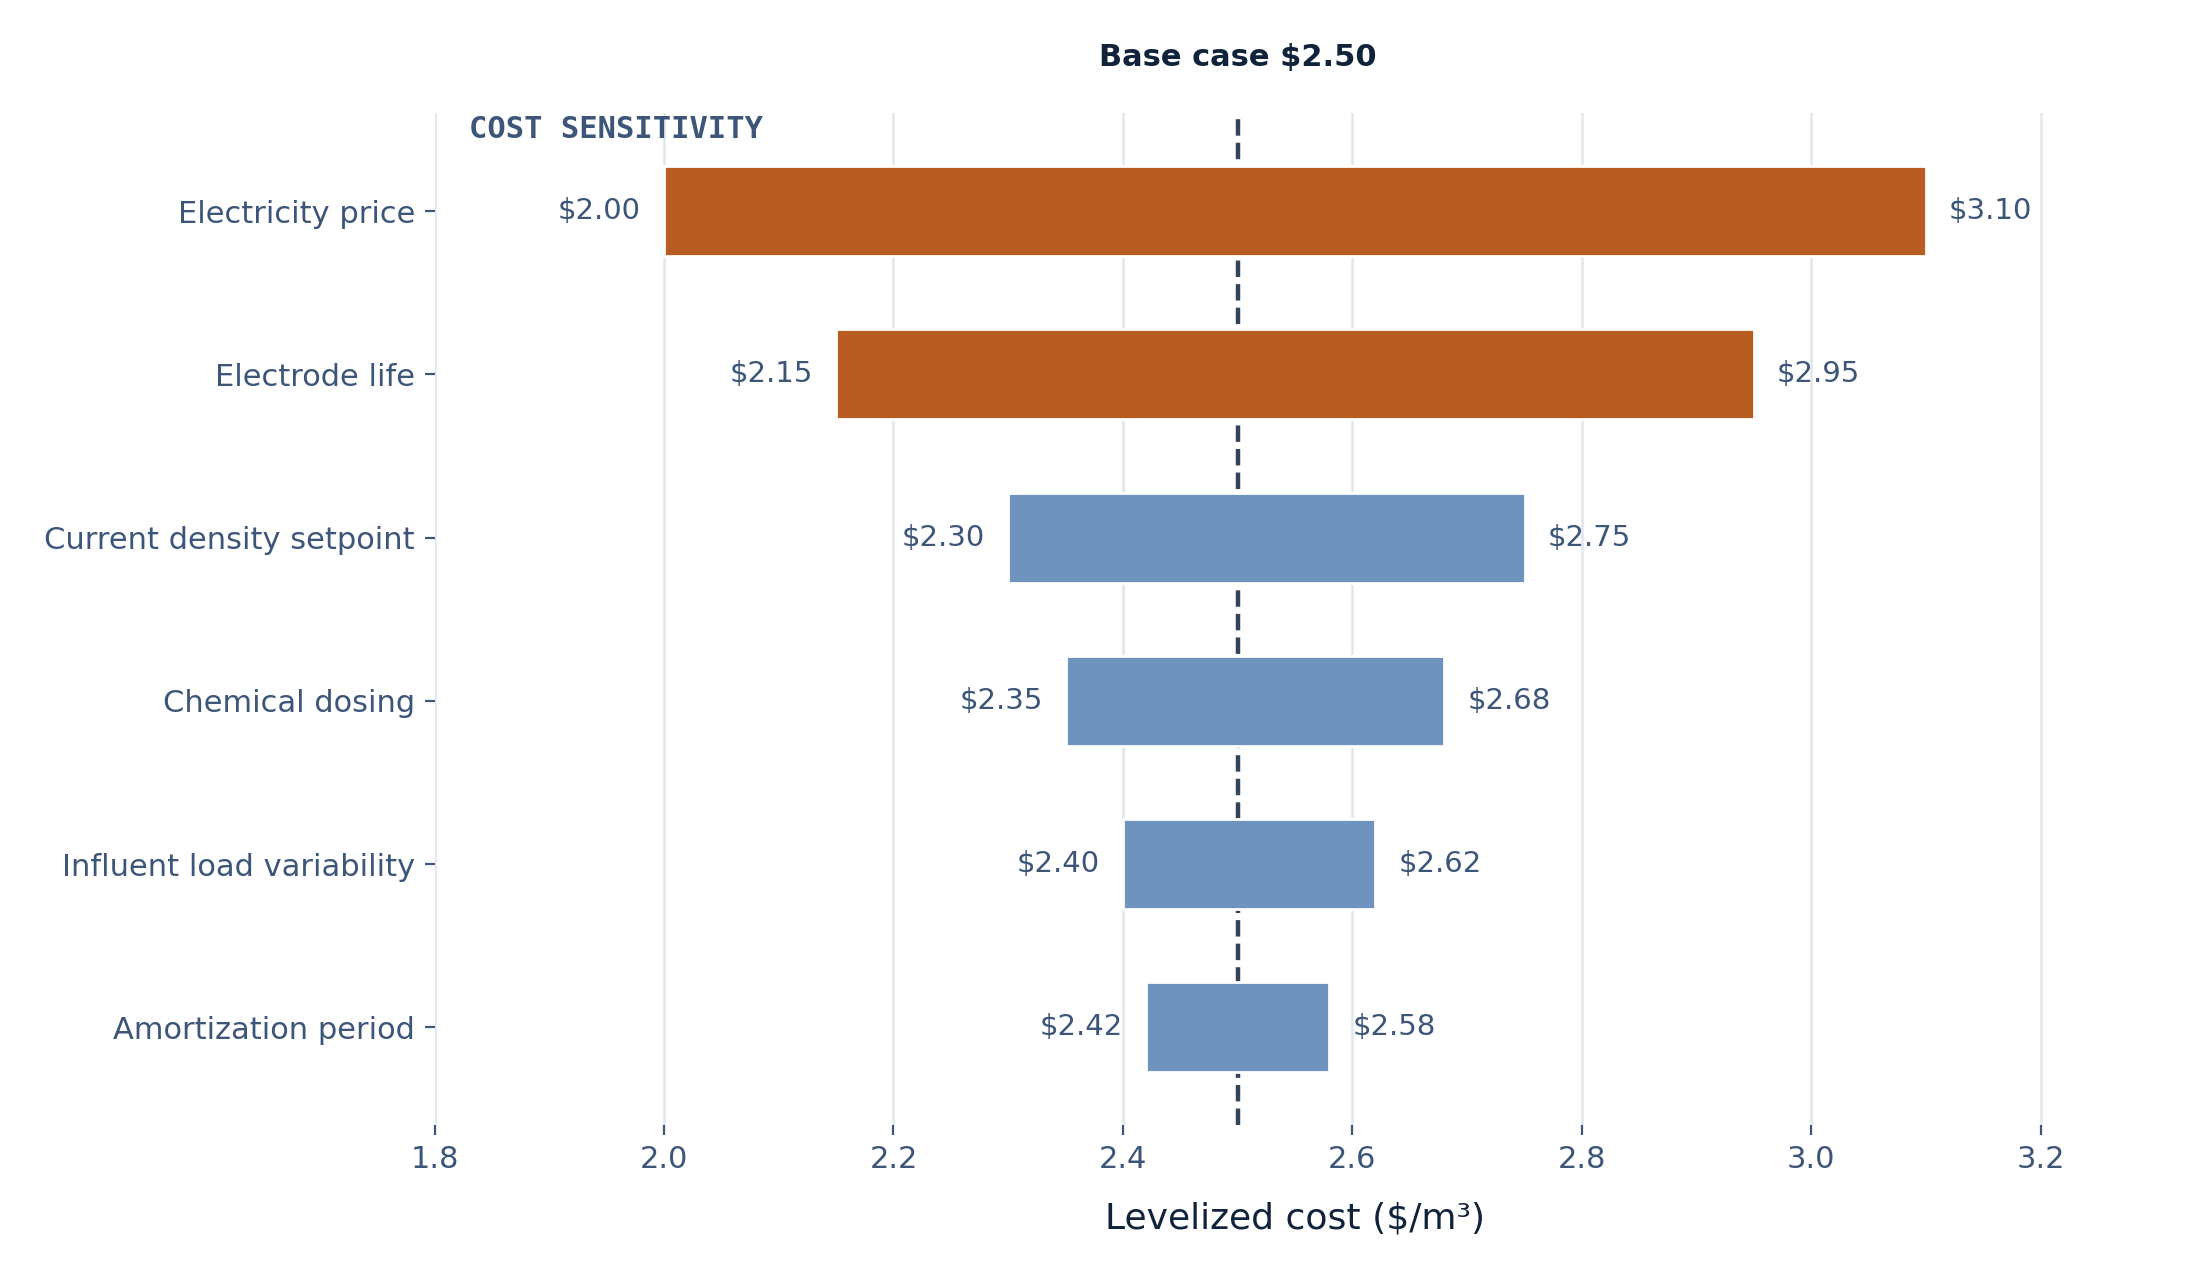
The model also needs to show its sensitivity. Electricity price and electrode life are the two assumptions that move the final number the most, and a model that does not show how the total shifts if either assumption is off by 20% will not survive a serious technical review.
CAPEX Components
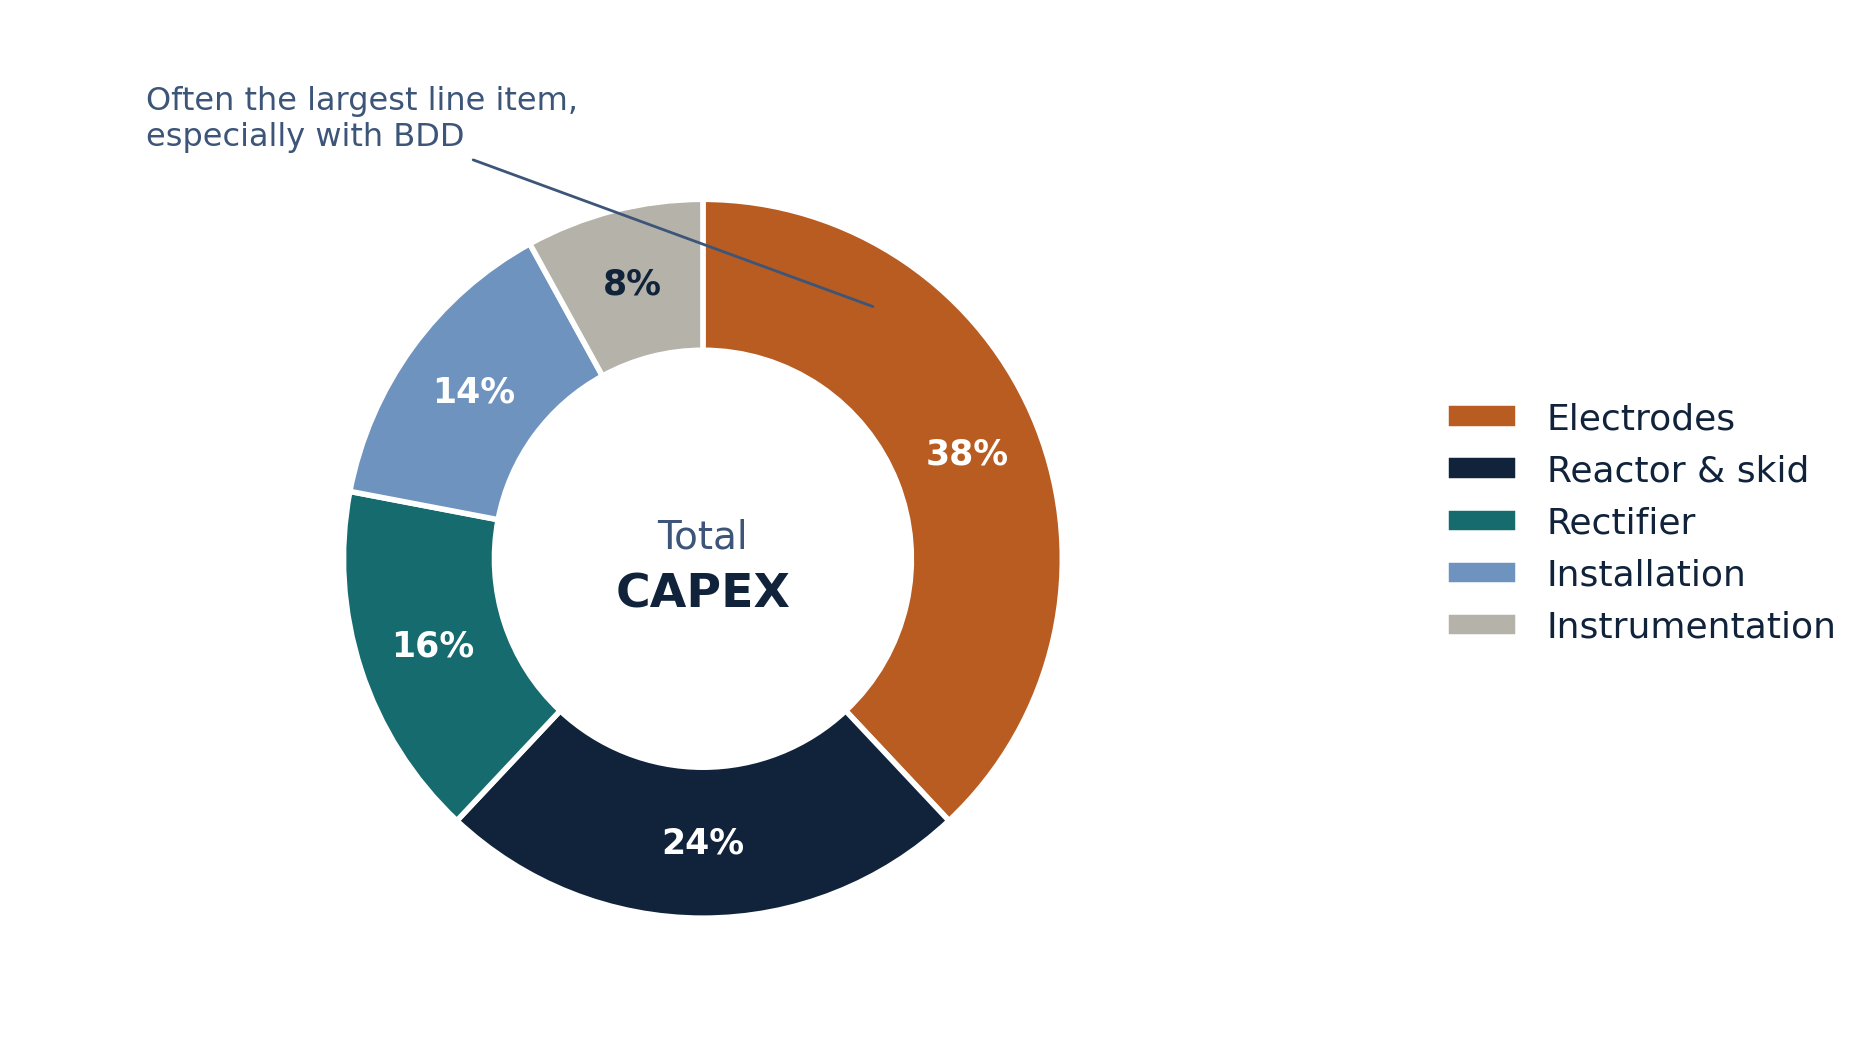
Reactor vessels and skid structure, electrodes (frequently the single largest capital line item, especially with BDD), the rectifier/power supply, instrumentation and control systems, and installation labor make up the core capital stack. Electrode cost scales with total electrode area, which ties directly back to the current-density design decisions covered elsewhere in this cluster — a smaller, higher-current-density reactor needs less electrode area upfront but will consume that electrode faster, shifting cost from CAPEX toward OPEX.
Getting CAPEX and OPEX modeled on a consistent basis, so that a smaller/harder-working reactor and a larger/gentler reactor can be compared fairly on total cost of ownership rather than upfront price alone, is the difference between a genuinely comparable proposal and one that just looks cheaper on day one.
OPEX Components
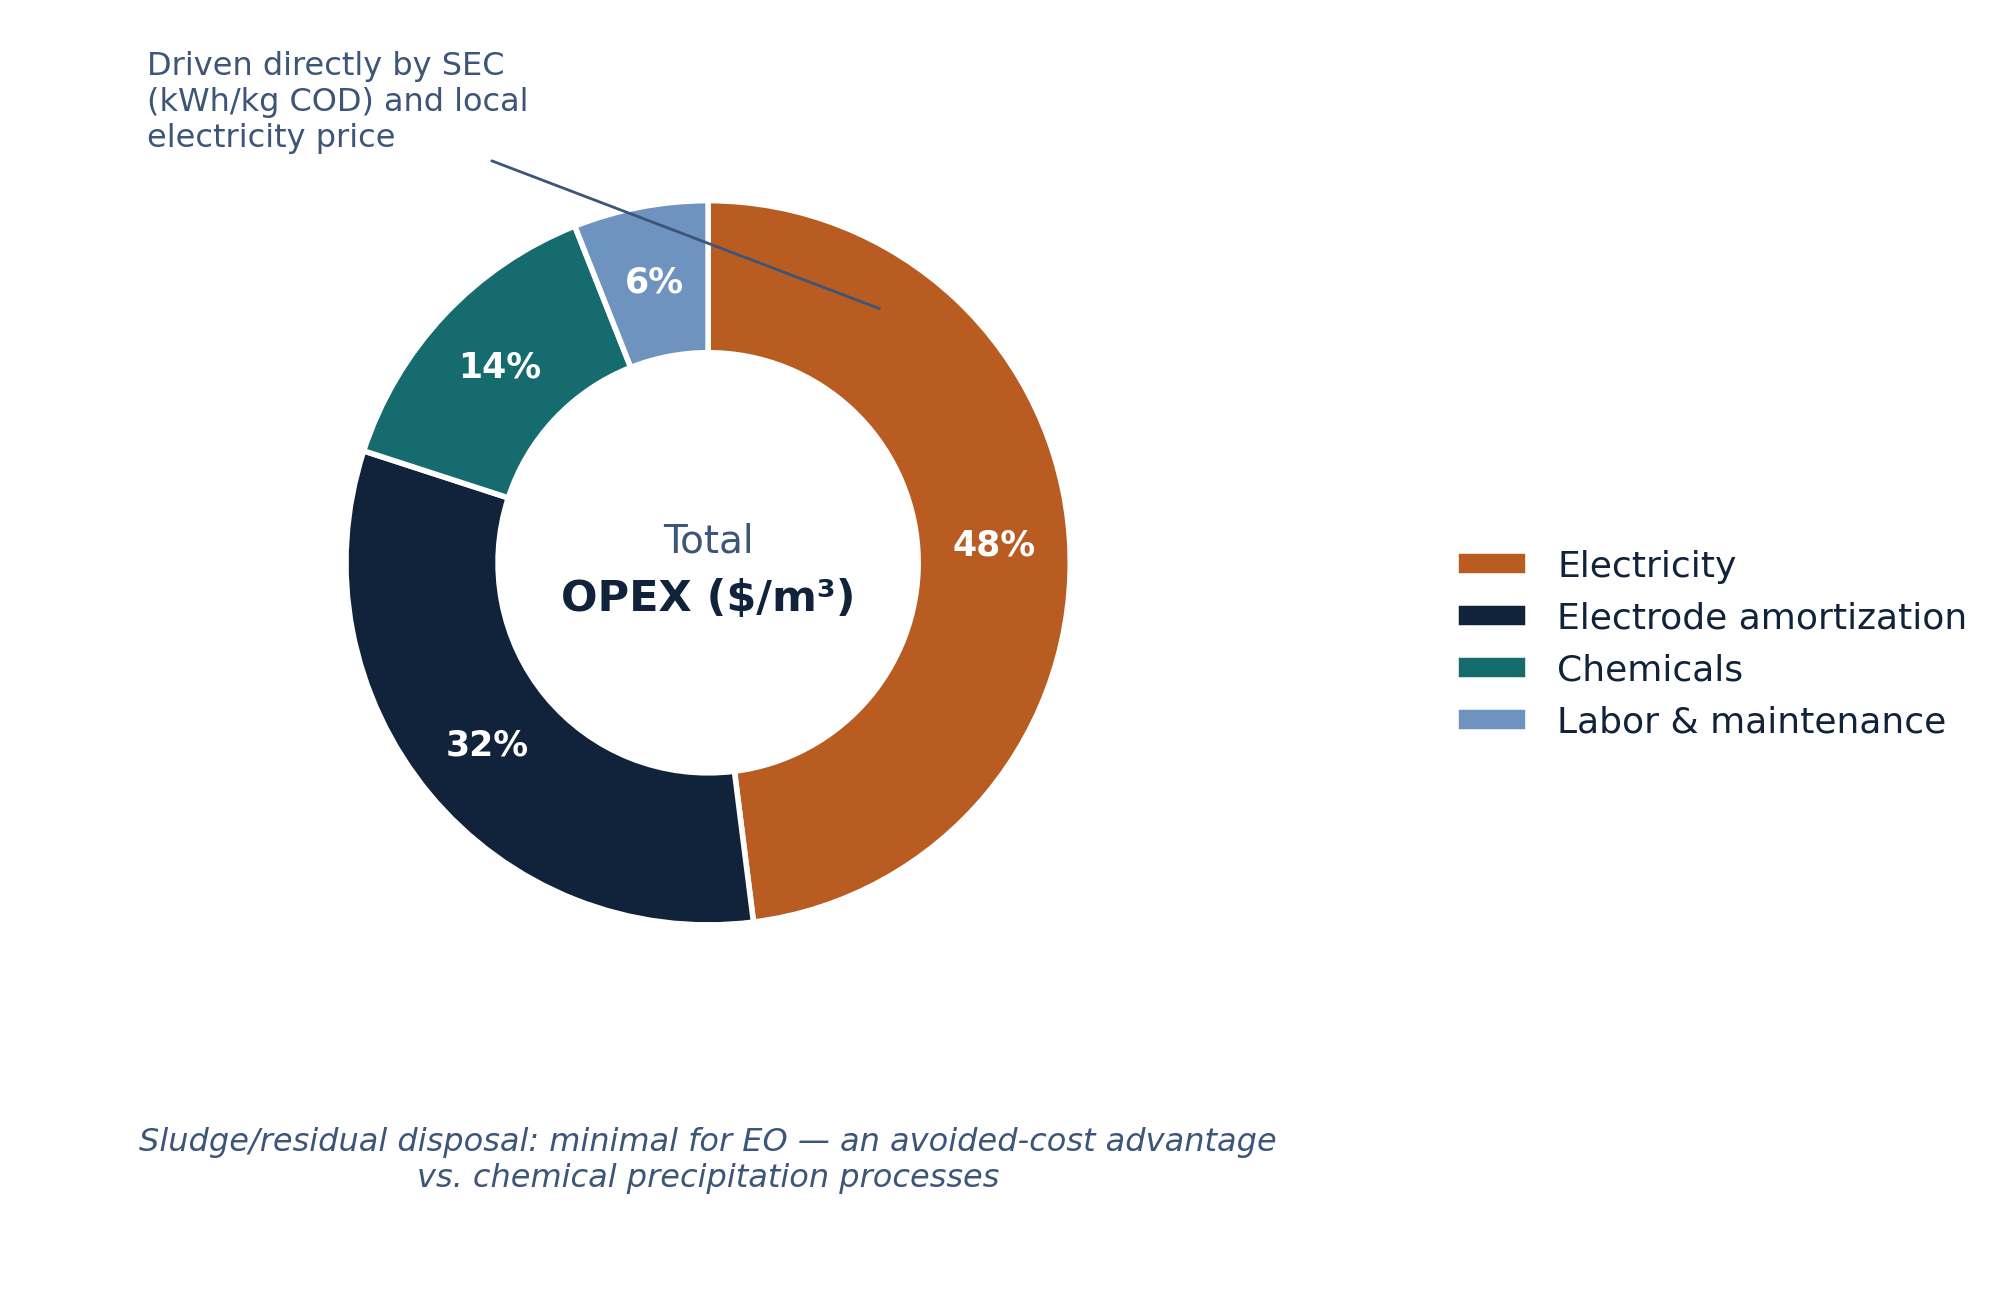
Electricity is almost always the largest recurring OPEX line, calculated directly from the specific energy consumption (kWh/kg COD) figure and local electricity price. This is why the energy-optimization work covered elsewhere in this cluster is not a secondary concern — it is frequently the single biggest lever on the final $/m³ number.
Electrode replacement cost, amortized over expected Ah/cm² service life and converted to a per-m³ basis, is the second major line. Chemicals (electrolyte or conductivity-enhancement dosing, pH adjustment, dechlorination reagent) and labor/maintenance round out the model. Sludge or residual disposal cost is usually minimal for EO compared to chemical precipitation processes, and is worth calling out explicitly as an avoided-cost advantage when comparing against alternatives that do generate significant sludge.
Building the Levelized $/m³ Model
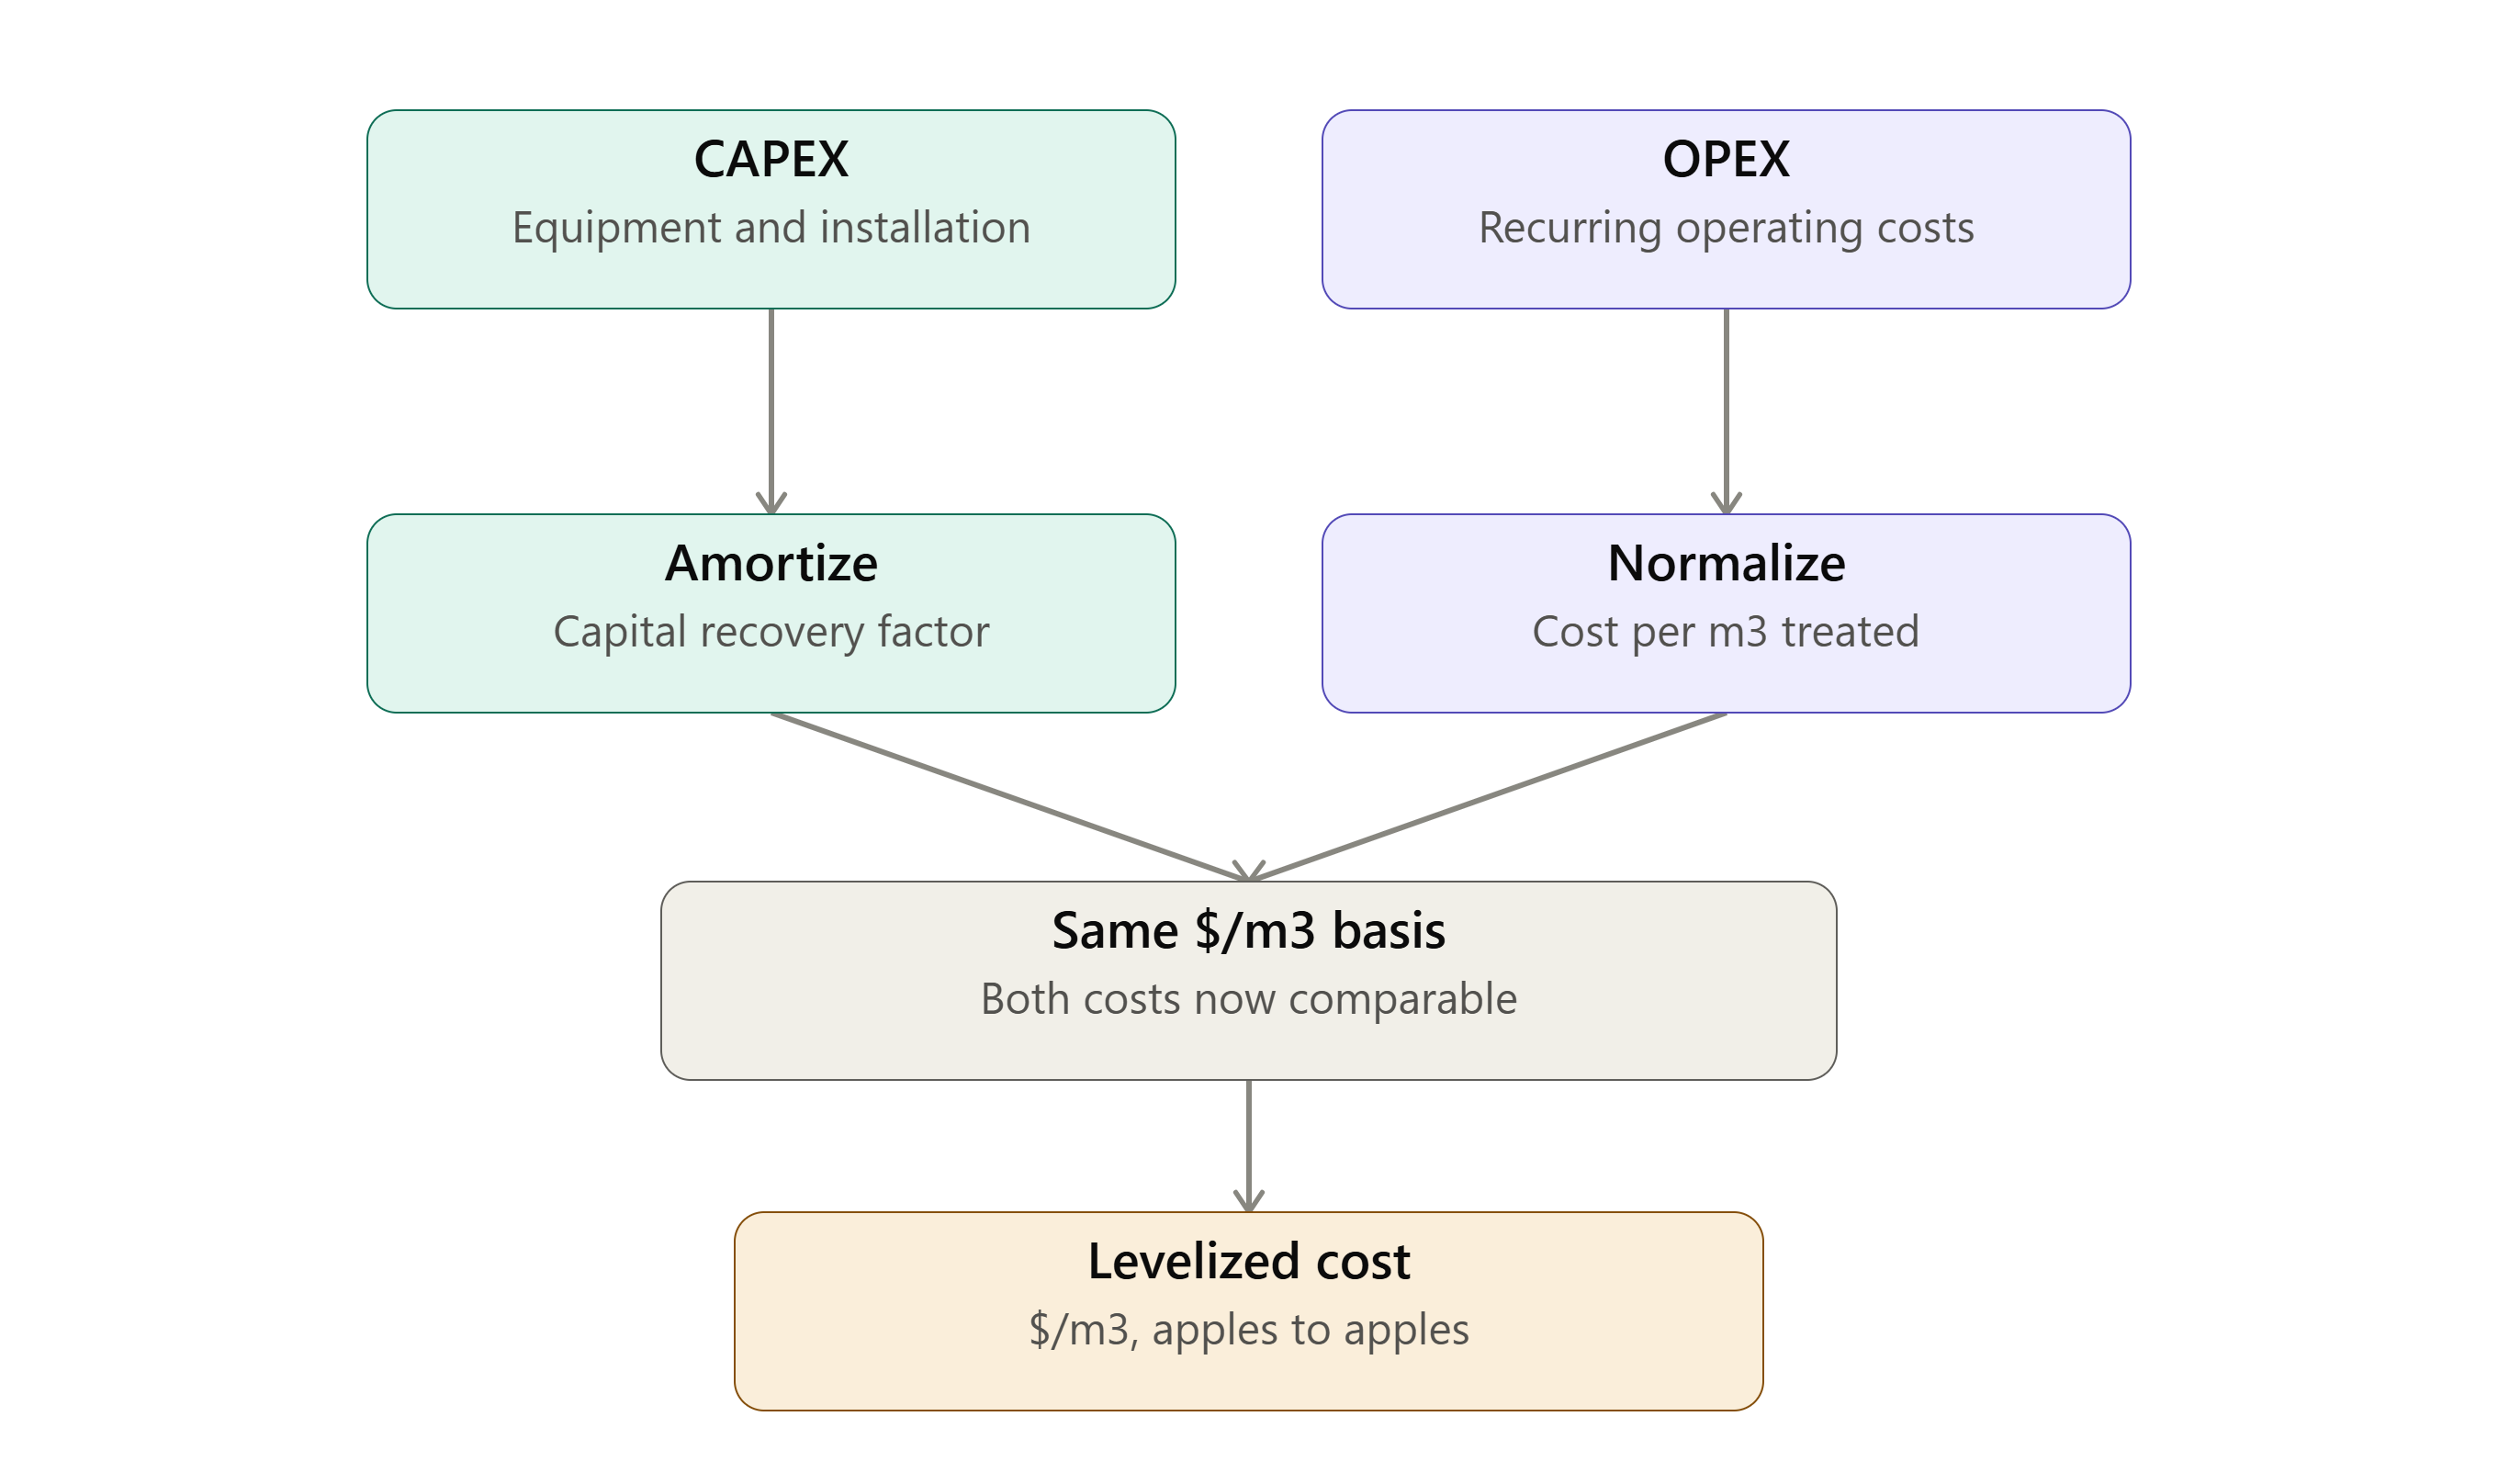
Levelizing means converting every cost — capital recovered over its useful life, electrodes amortized over their Ah/cm²-based replacement interval, electricity and chemicals on a per-m³ basis — into a single consistent unit so the whole system can be compared apples to apples against alternative treatment technologies or against a competing EO proposal with different design parameters.
A model that mixes an upfront capital number with a separate annual operating number, without levelizing both to the same basis, makes it easy to unintentionally favor whichever proposal front-loads or back-loads its costs differently. Insist on one number, on one basis, before comparing options.
Sensitivity Analysis: What Actually Moves the Number
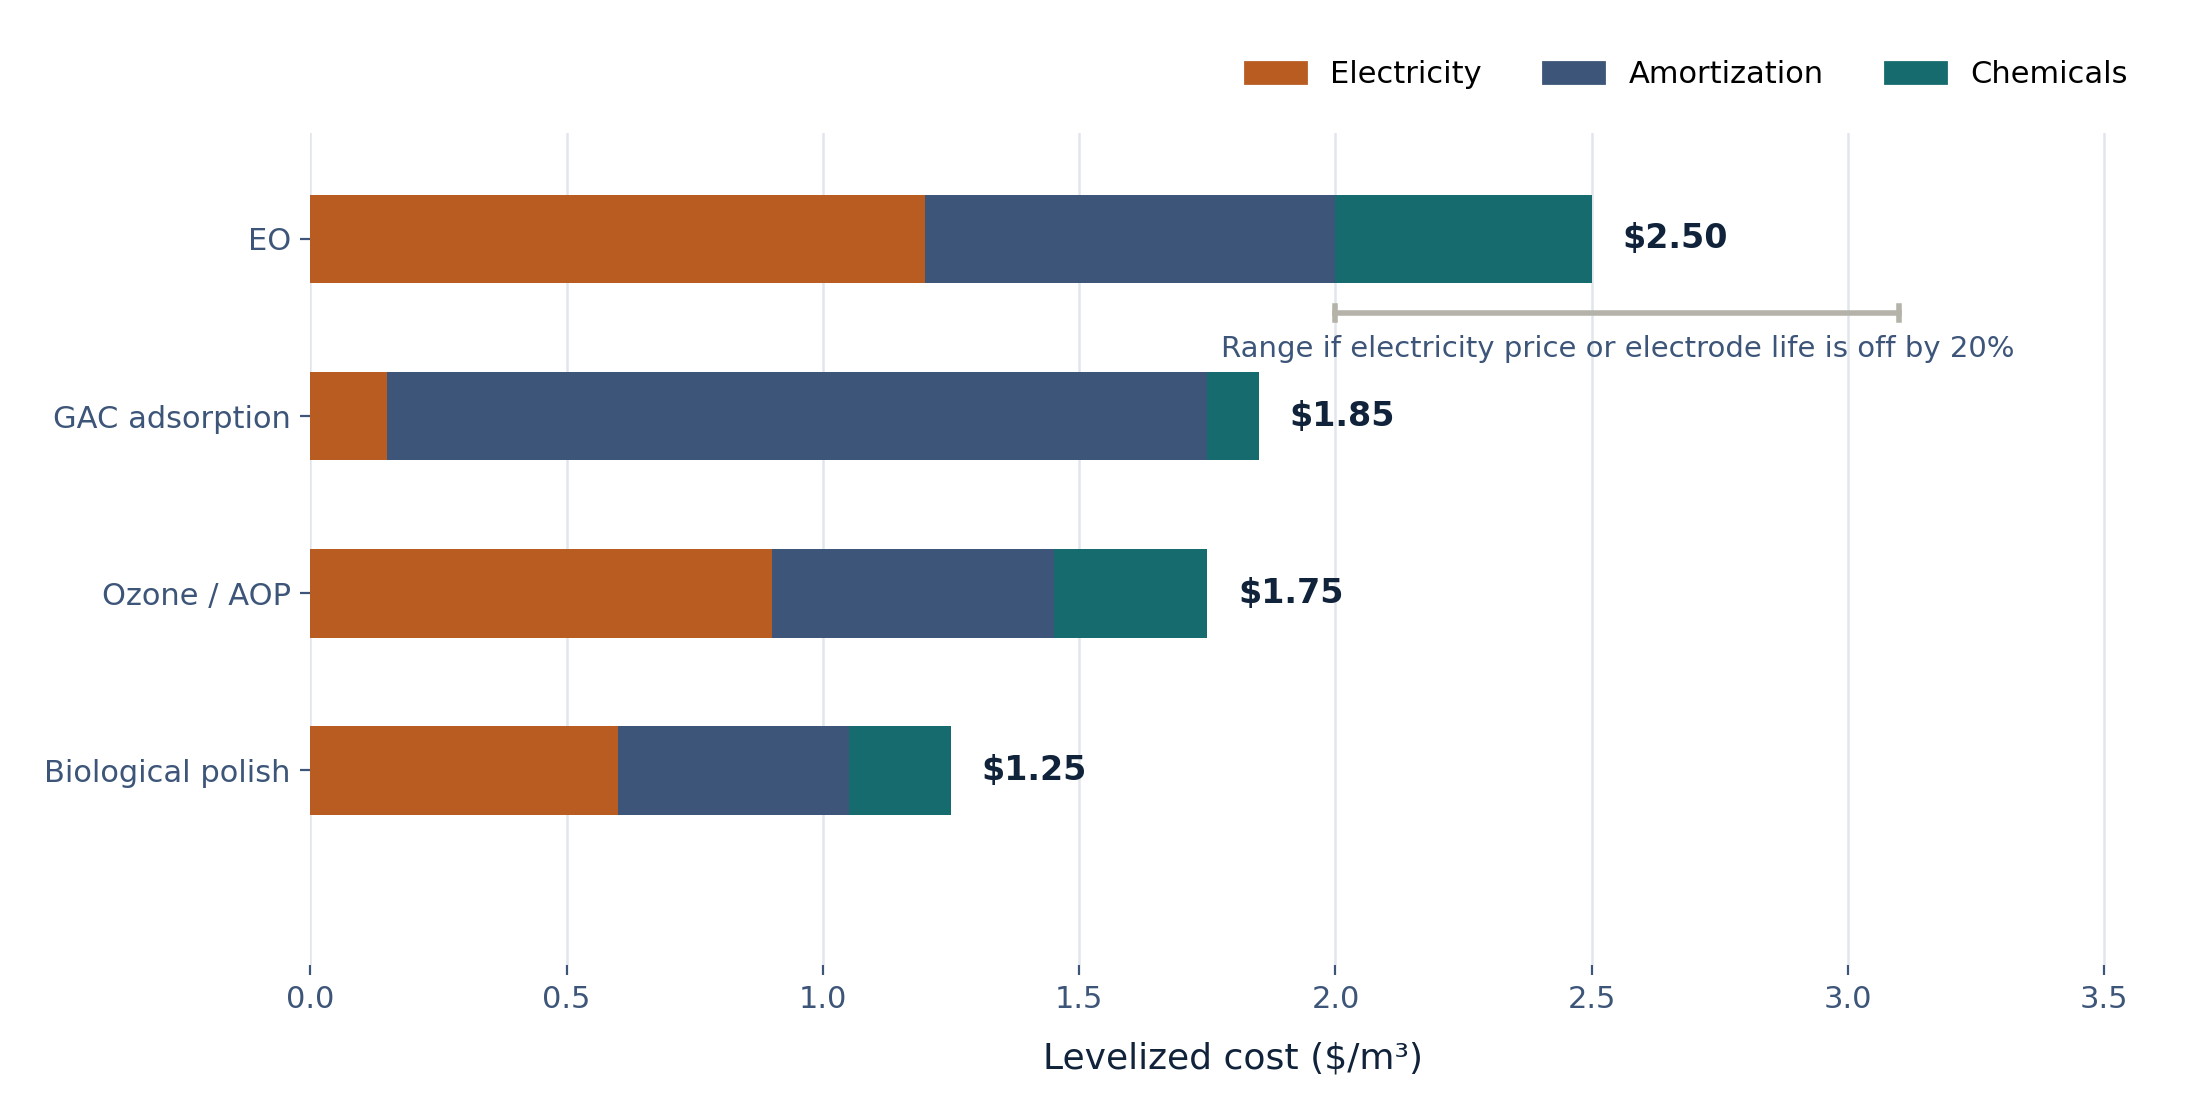
Electricity price and electrode service life are the two assumptions worth stress-testing explicitly, since they typically account for most of the swing in a well-built model. Running the model at electricity prices 20% above and below the base case, and at electrode life 20% shorter and longer than the base case, shows a decision-maker the realistic range rather than a single point estimate that looks more precise than the underlying assumptions justify.
This sensitivity view is also the strongest tool for justifying EO’s higher upfront capital cost against lower-CAPEX alternatives: showing that EO’s total cost of ownership holds up even under a pessimistic electricity-price or electrode-life scenario is a more persuasive argument than any single base-case number.
Dominant OPEX Line
Electricity, calculated directly from specific energy consumption (kWh/kg COD) and local electricity price
Second OPEX Line
Electrode replacement, amortized over expected Ah/cm² service life and converted to a per-m³ basis
Key Sensitivity Variables
Electricity price and electrode life; stress-test both at plus/minus 20% before presenting a base-case number
Pressure-test the cost model before it goes into a proposal
The bench data that pins down the SEC and electrode-life assumptions driving this model.
CAPEX vs OPEX: Where the Operational Cost Actually Sits
Reactor vessel, electrodes, rectifier, instrumentation, and installation. Electrode area (tied to current density design choice) is usually the largest single line.
Electricity (usually electricity is the major OPEX), electrode amortization, chemicals, and labor. Sludge/residual disposal is typically minimal compared to chemical precipitation alternatives.
CAPEX and OPEX converted to a consistent $/m³ basis for fair comparison against alternative technologies or competing proposals with different design parameters.
Common Operational Cost Modeling Mistakes
A cheaper reactor that runs at higher current density may cost less upfront but consume electrodes faster and cost more electricity per m³ treated. Levelize before comparing.
Electricity price volatility over a multi-year electrode replacement cycle can shift the total cost picture meaningfully. Model a realistic price range, not a single snapshot.
Lower sludge generation compared to chemical precipitation, and avoided chemical procurement/storage, are real cost offsets that a narrow electricity-and-electrodes-only model misses.
Actual Ah/cm² life depends on current density, chloride level, and operating discipline — all plant-specific. A base case using a supplier’s best-case life figure without a sensitivity range overstates confidence.
Where does this take you next?
A cost model is only as good as what it is built on. Where you go next depends on how confident you are in the inputs.
Model is ready to present
Package the case and request a proposal-level engineering consult.
Need to validate assumptions
Treatability data confirm SEC, electrode-life figures the model depends on.
Still comparing technologies
See how EO’s total cost of ownership holds up against the alternatives.
Get a defensible cost model for your proposal
Send us your flow rate, target removal, and local electricity price and we will build a levelized $/m³ model with sensitivity analysis you can present internally.
More in Engineering & System Design
Guide To The EO Decision Gate, that is answer the question: Is EO Right for you?