Electrochemical Oxidation / Engineering & System Design / Electrode Lifetime Management
Managing Electrode Lifetime and Replacement Cost
Electrodes are usually the largest single line item in an EO budget after electricity. Ampere-hours per unit area, not calendar time, is the metric that actually predicts when they fail.
Guide To EO Decision Gate
Why This Matters
Electrode service life is reported in years by suppliers because that is what a purchasing conversation wants to hear, but the underlying physics runs on cumulative charge passed per unit area — ampere-hours per square centimeter (Ah/cm2). Two identical electrodes run at different current densities will fail at very different calendar ages even though they may deliver a similar total Ah/cm2 before end of life.
Understanding the actual failure mechanism for the coating in use, and watching the right early-warning signal, is what separates a planned electrode swap from an unplanned plant shutdown.
Coating Depletion and Substrate Passivation
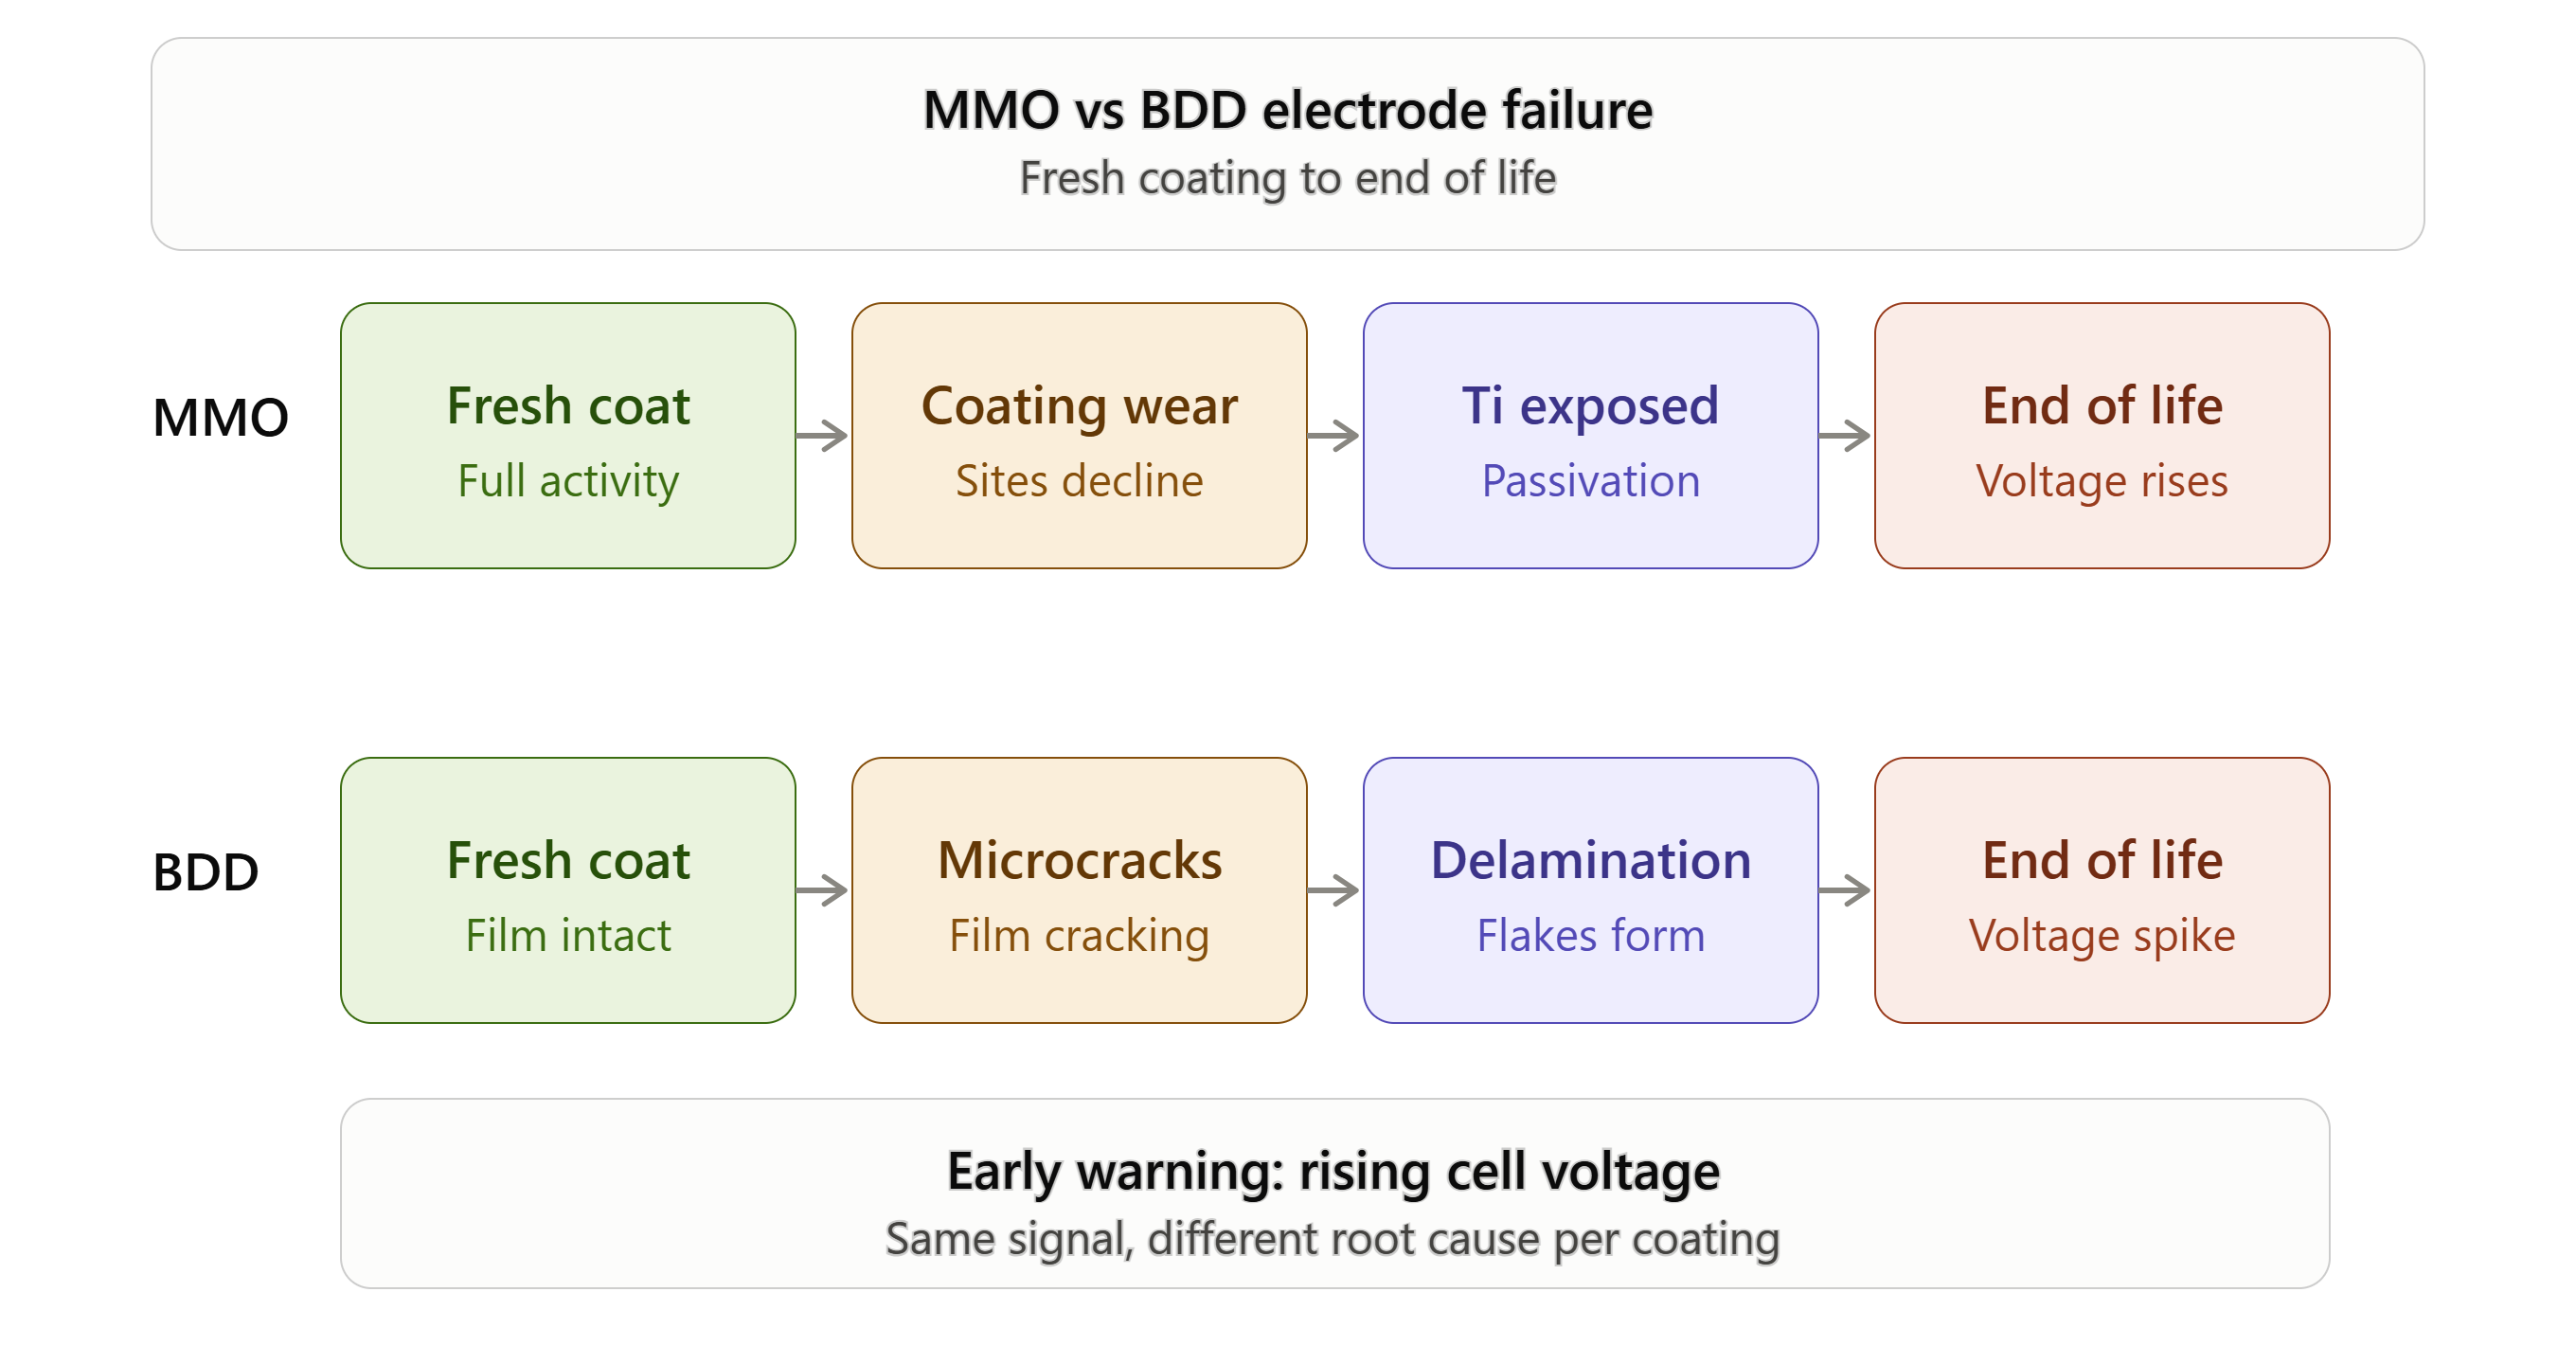
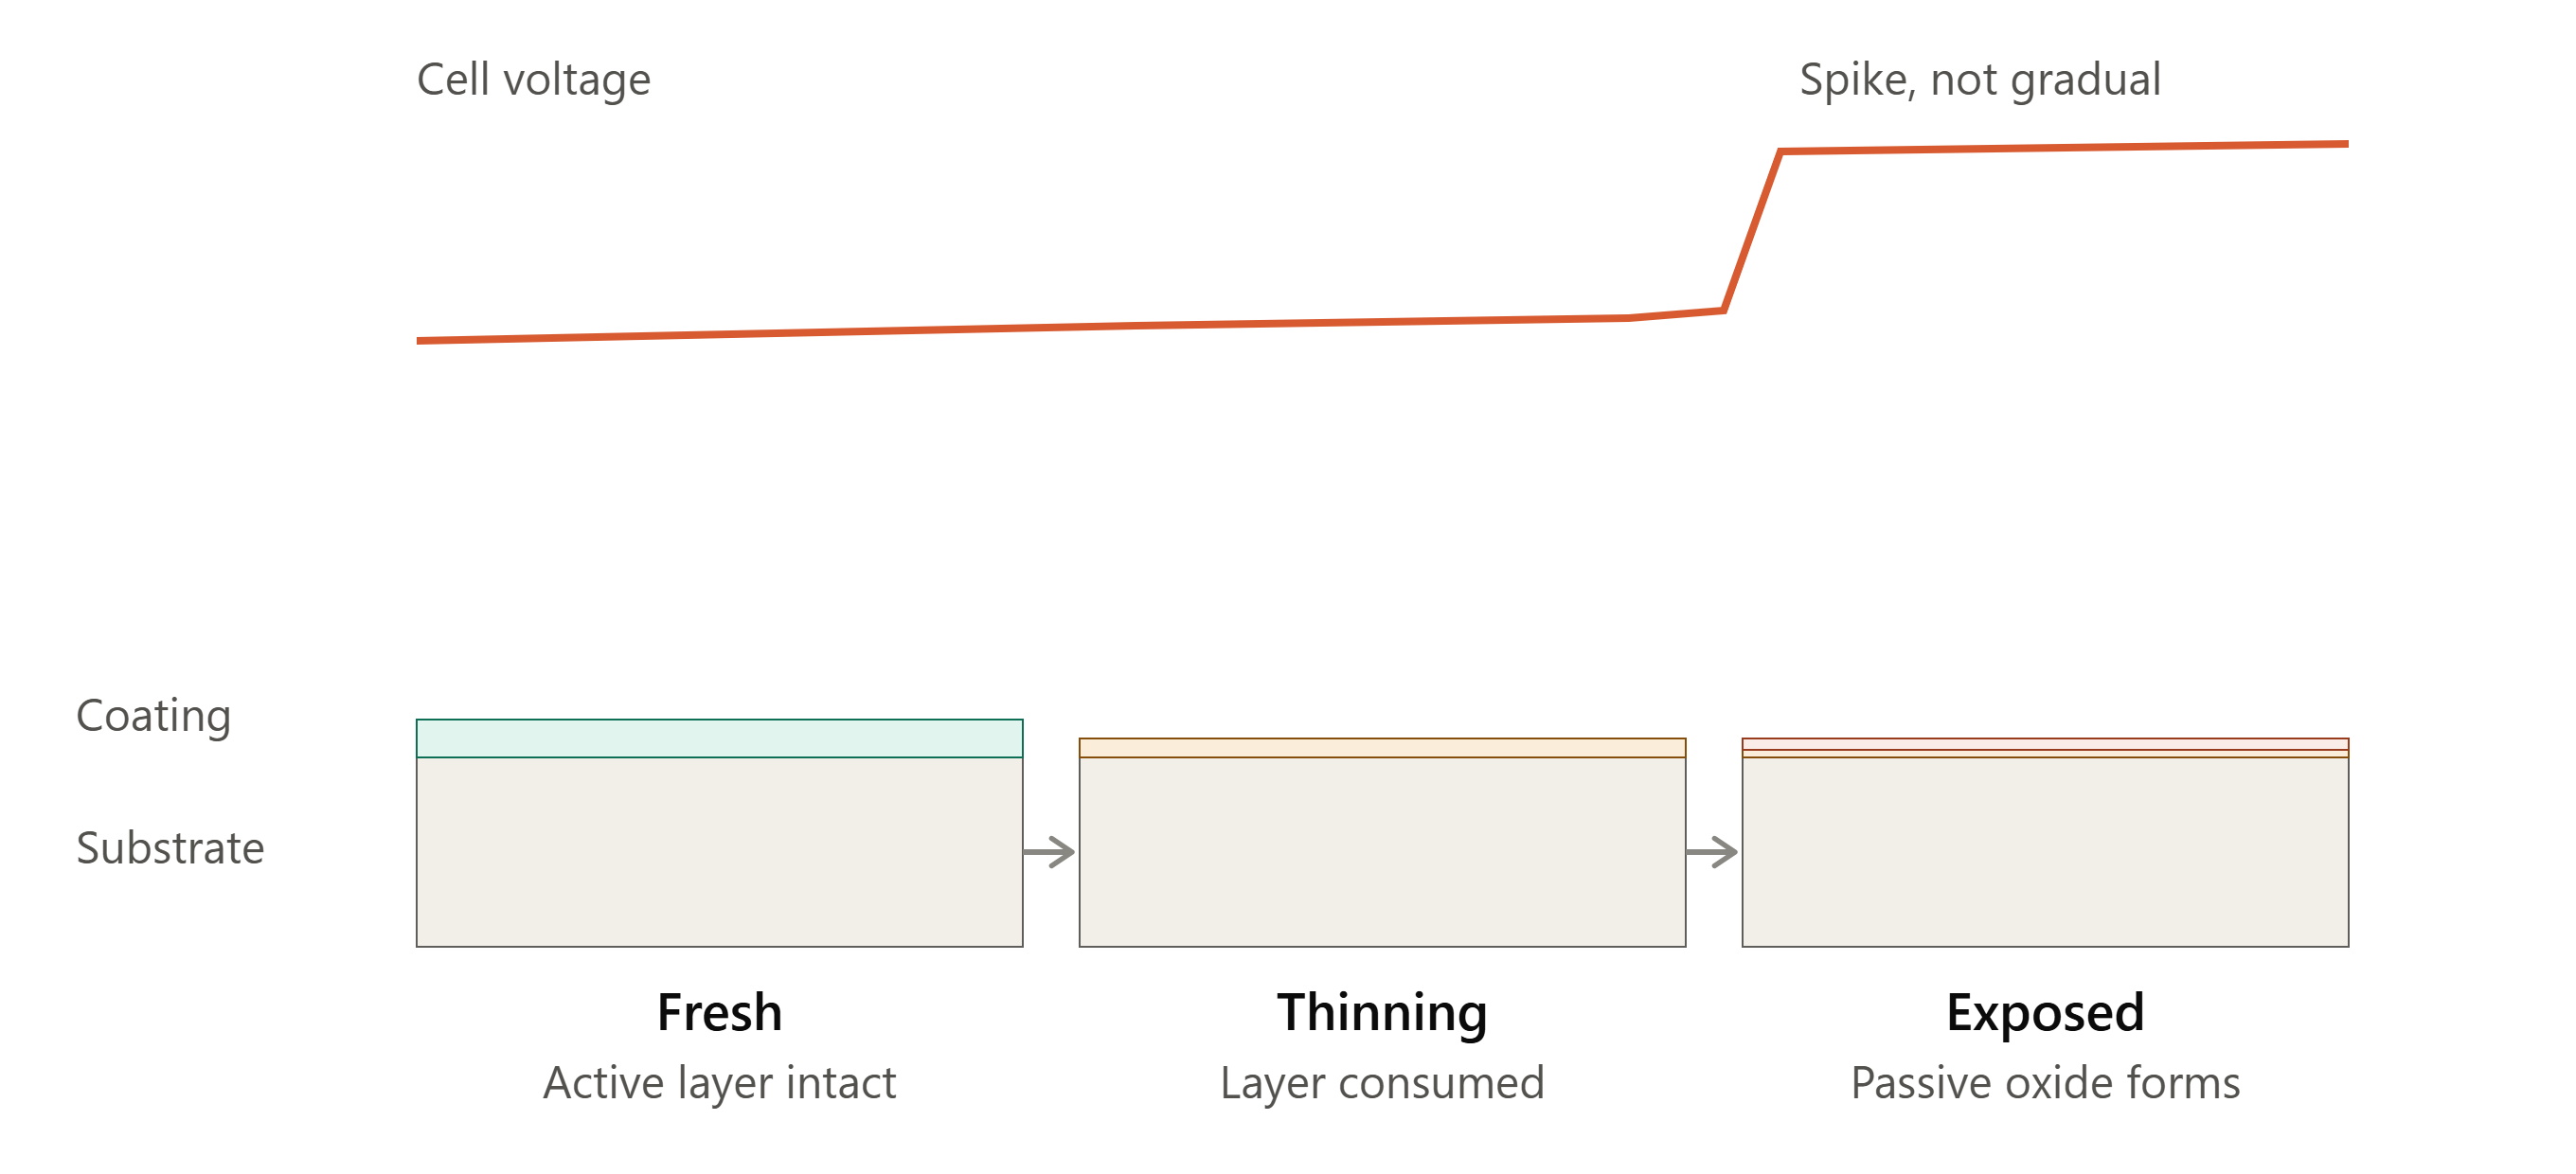
Mixed metal oxide (MMO) coatings on titanium substrates — commonly IrO2-Ta2O5 or RuO2-based formulations — are consumed gradually during operation, atom by atom, as the active oxide layer participates in the electrode reactions. Once the coating thins past a critical point, the underlying titanium substrate is exposed to the electrolyte and rapidly forms a passive, insulating oxide layer of its own. Voltage at that point does not creep up gradually; it spikes, because the electrode has effectively lost most of its conductive area at once.
Boron-doped diamond (BDD) electrodes fail differently. Rather than gradual coating consumption, BDD failure is typically delamination-driven: the diamond film separating from its substrate (commonly niobium or silicon) due to thermal cycling stress or substrate corrosion at coating defects. BDD generally offers a longer service life than MMO under comparable conditions, at a materially higher upfront cost per unit area.
What Actually Drives Degradation Rate
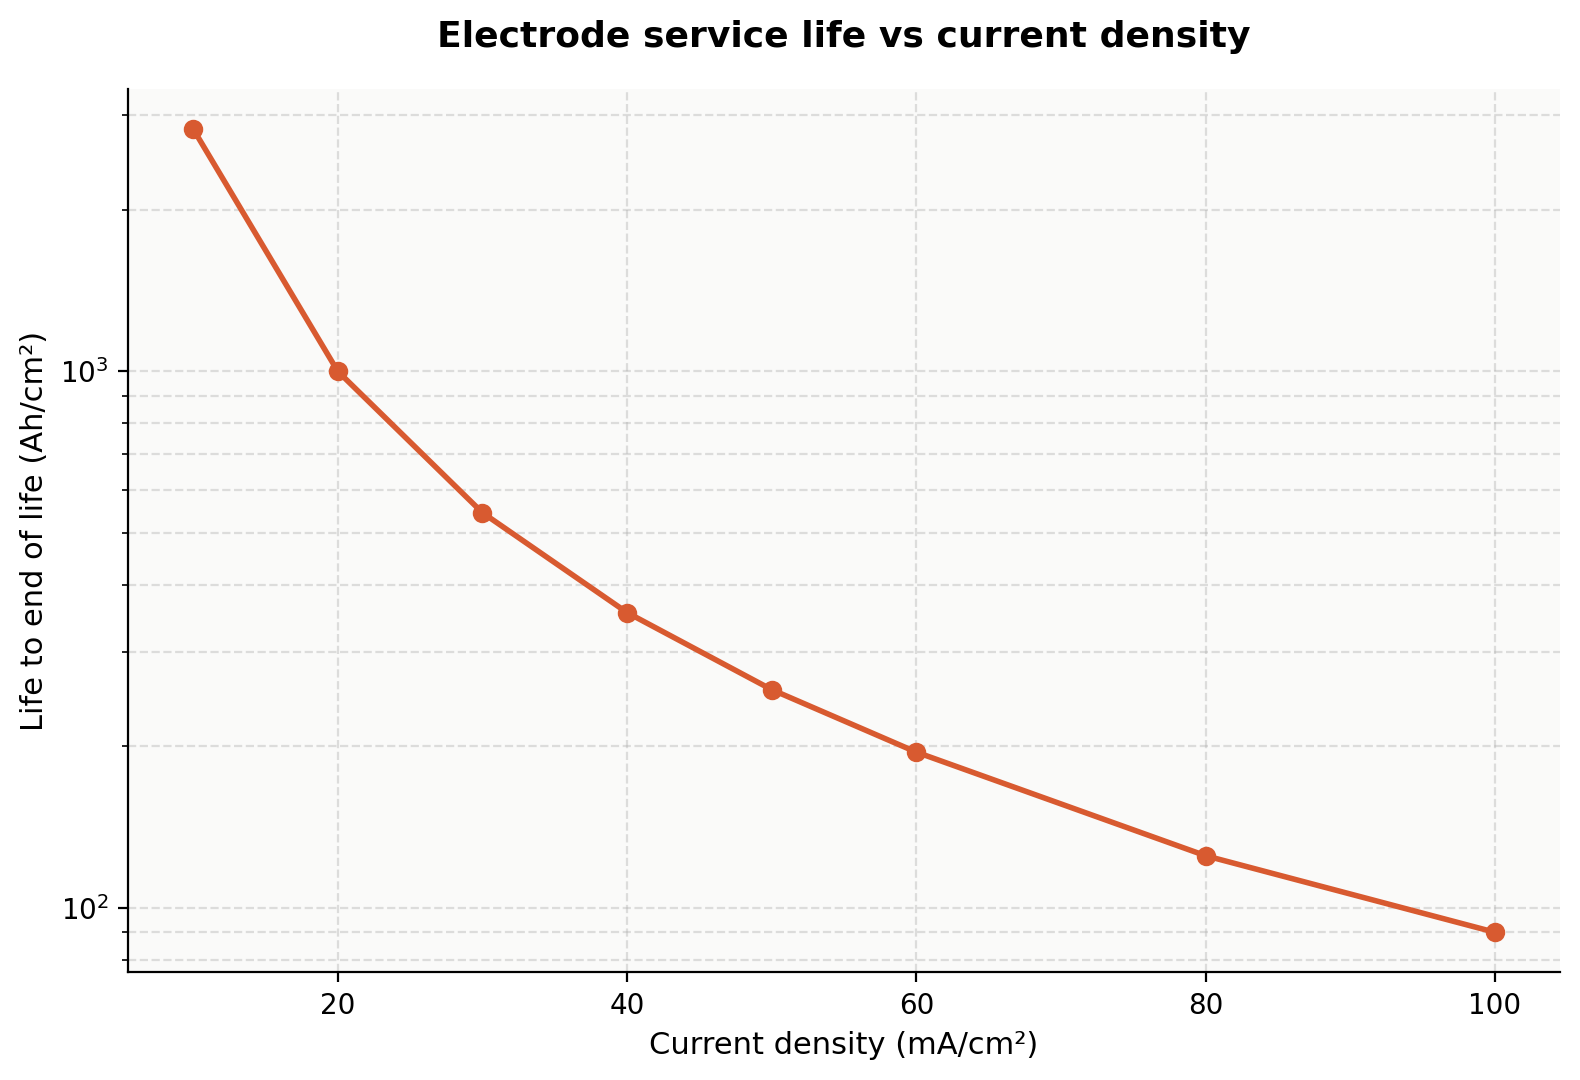
Current density is the dominant variable. Running an electrode at twice the current density does not simply halve its calendar life — it typically shortens life by more than half, since higher current density also raises local heating and accelerates coating-consumption side reactions. This is the direct tradeoff against the energy-optimization guidance on this site: pushing current density higher to shrink reactor footprint or hit throughput targets pulls electrode life down faster than the relationship looks linear.
Chloride concentration matters independently of current density. Active chlorine evolution at the anode is itself an oxidative environment that attacks certain coating chemistries faster than a chloride-free stream would. Elevated temperature and any excursions into reverse polarity beyond the design duty cycle both compound degradation further.
Voltage Rise as the Early-Warning Signal
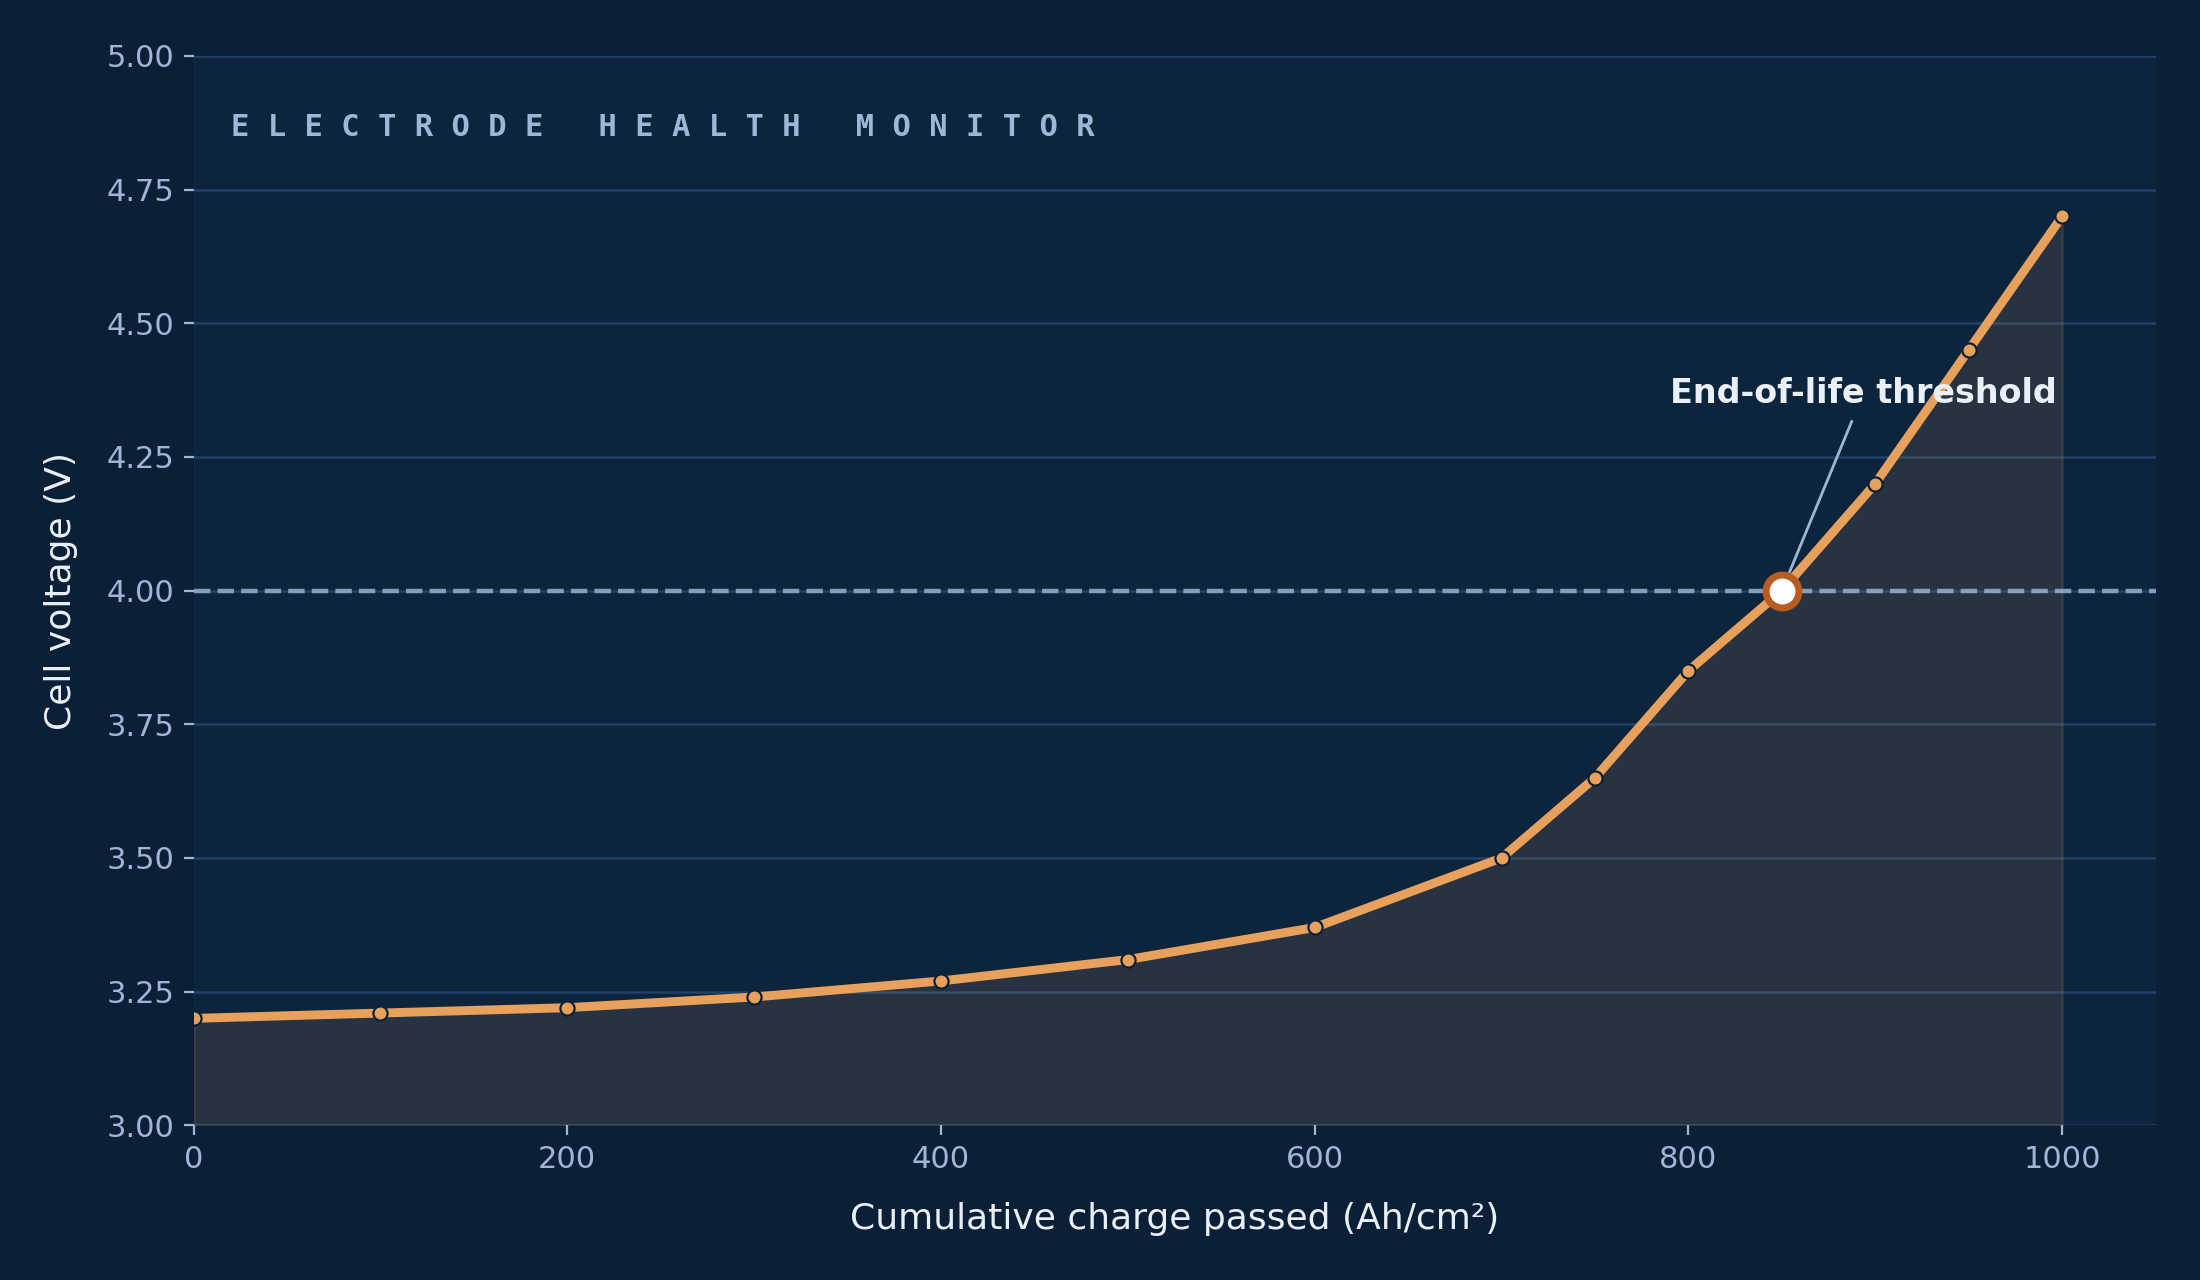
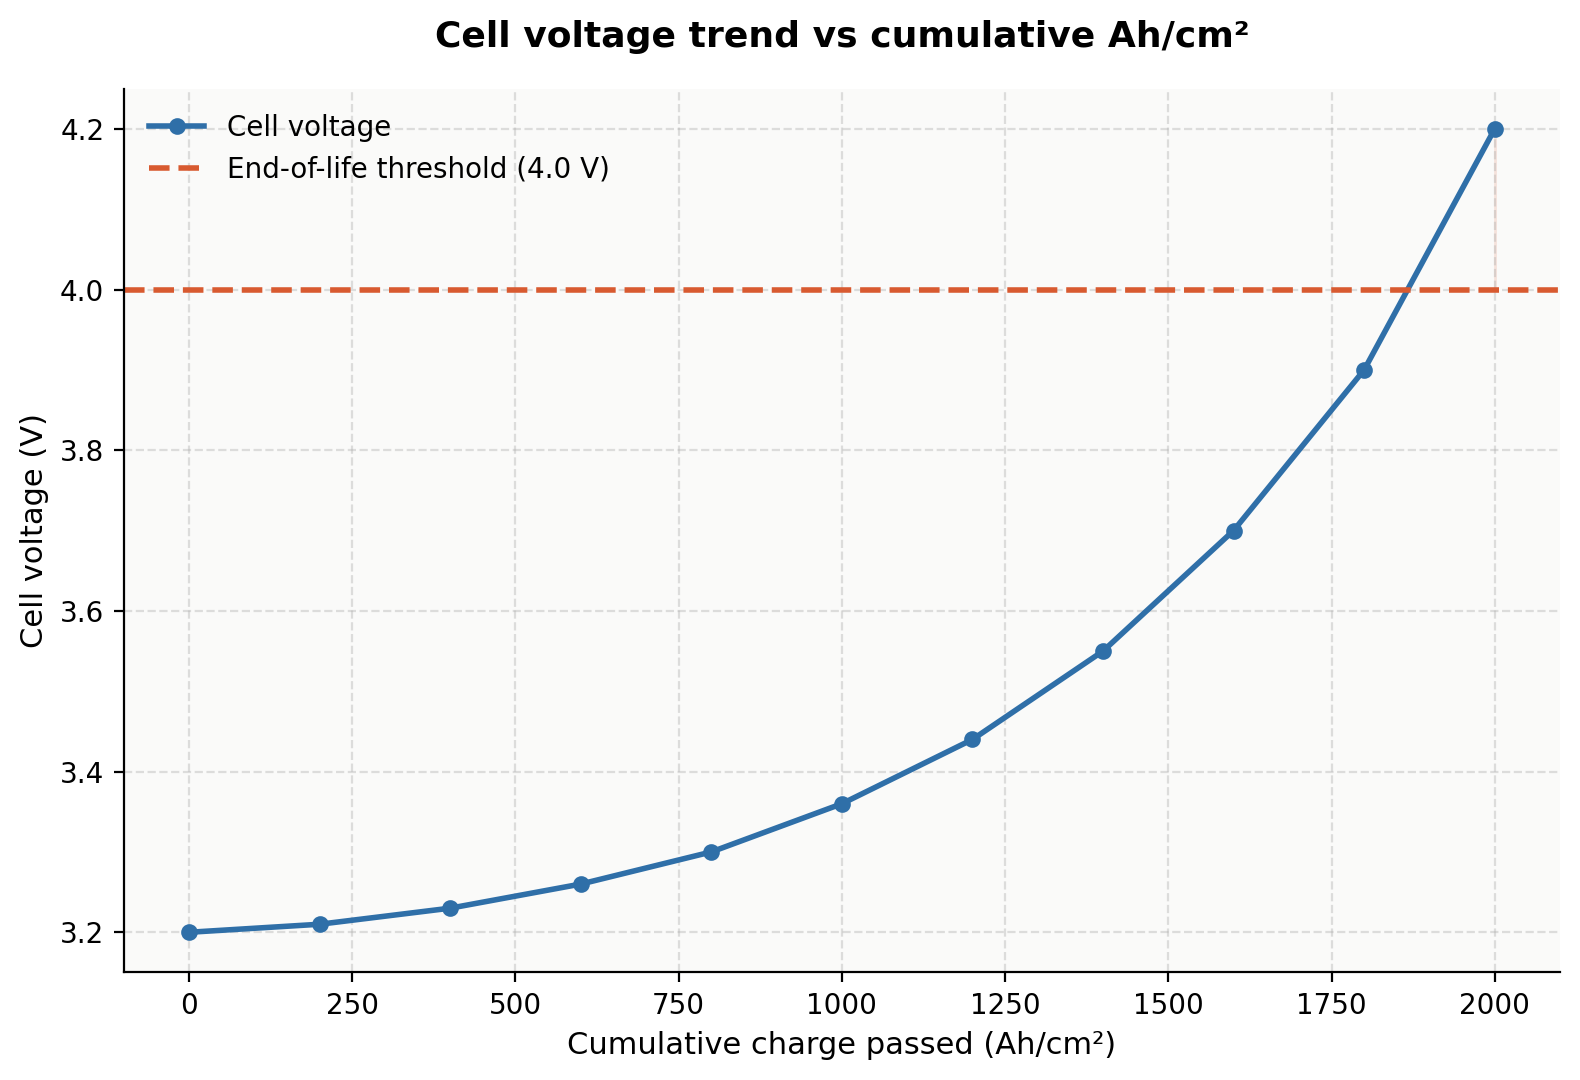
A healthy electrode holds a fairly stable cell voltage at constant current density. Gradual upward voltage drift over weeks or months at otherwise constant operating conditions is the clearest available signal that coating is depleting, well before performance failure. Trending voltage against cumulative Ah/cm2, rather than against calendar time, turns this into a genuinely predictive maintenance signal instead of a reactive one.
Set a defined end-of-life voltage threshold during commissioning, tied to the rectifier’s practical voltage ceiling, and treat approaching that threshold as the trigger for scheduling a replacement — not as a surprise discovered after a compliance excursion.
Refurbishment and Spare-Parts Strategy
Running EO on a fixed setpoint (constant current or constant time) treats every batch as if influent load never varies, which it does. Feedback control on oxidation-reduction potential (ORP) or an inline COD/TOC surrogate lets the rectifier back off once the target degradation is reached, instead of continuing to apply current — and cost — to a stream that has already met spec.
This is frequently the single highest-return optimization available on an existing installation, because it requires no reactor modification, only instrumentation and control logic on equipment already installed.
Real Lifetime Metric
Cumulative Ah/cm2 delivered, not calendar time, is what predicts electrode end of life
Current Density Tradeoff
Doubling current density typically more than halves service life, not a proportional reduction
Early-Warning Signal
Gradual cell voltage rise at constant current density, tracked against cumulative Ah/cm2
Real Ah/cm² life is matrix-specific — pilot data confirms it
How a pilot’s electrode screening step produces a real degradation-rate estimate for your matrix.
Engineering Process
Where electrode selection sits in the full bench-to-commercial sequence.
Check whether your chloride and current-density profile flags an elevated degradation risk.
MMO vs BDD Electrode: Lifetime and Cost Tradeoff
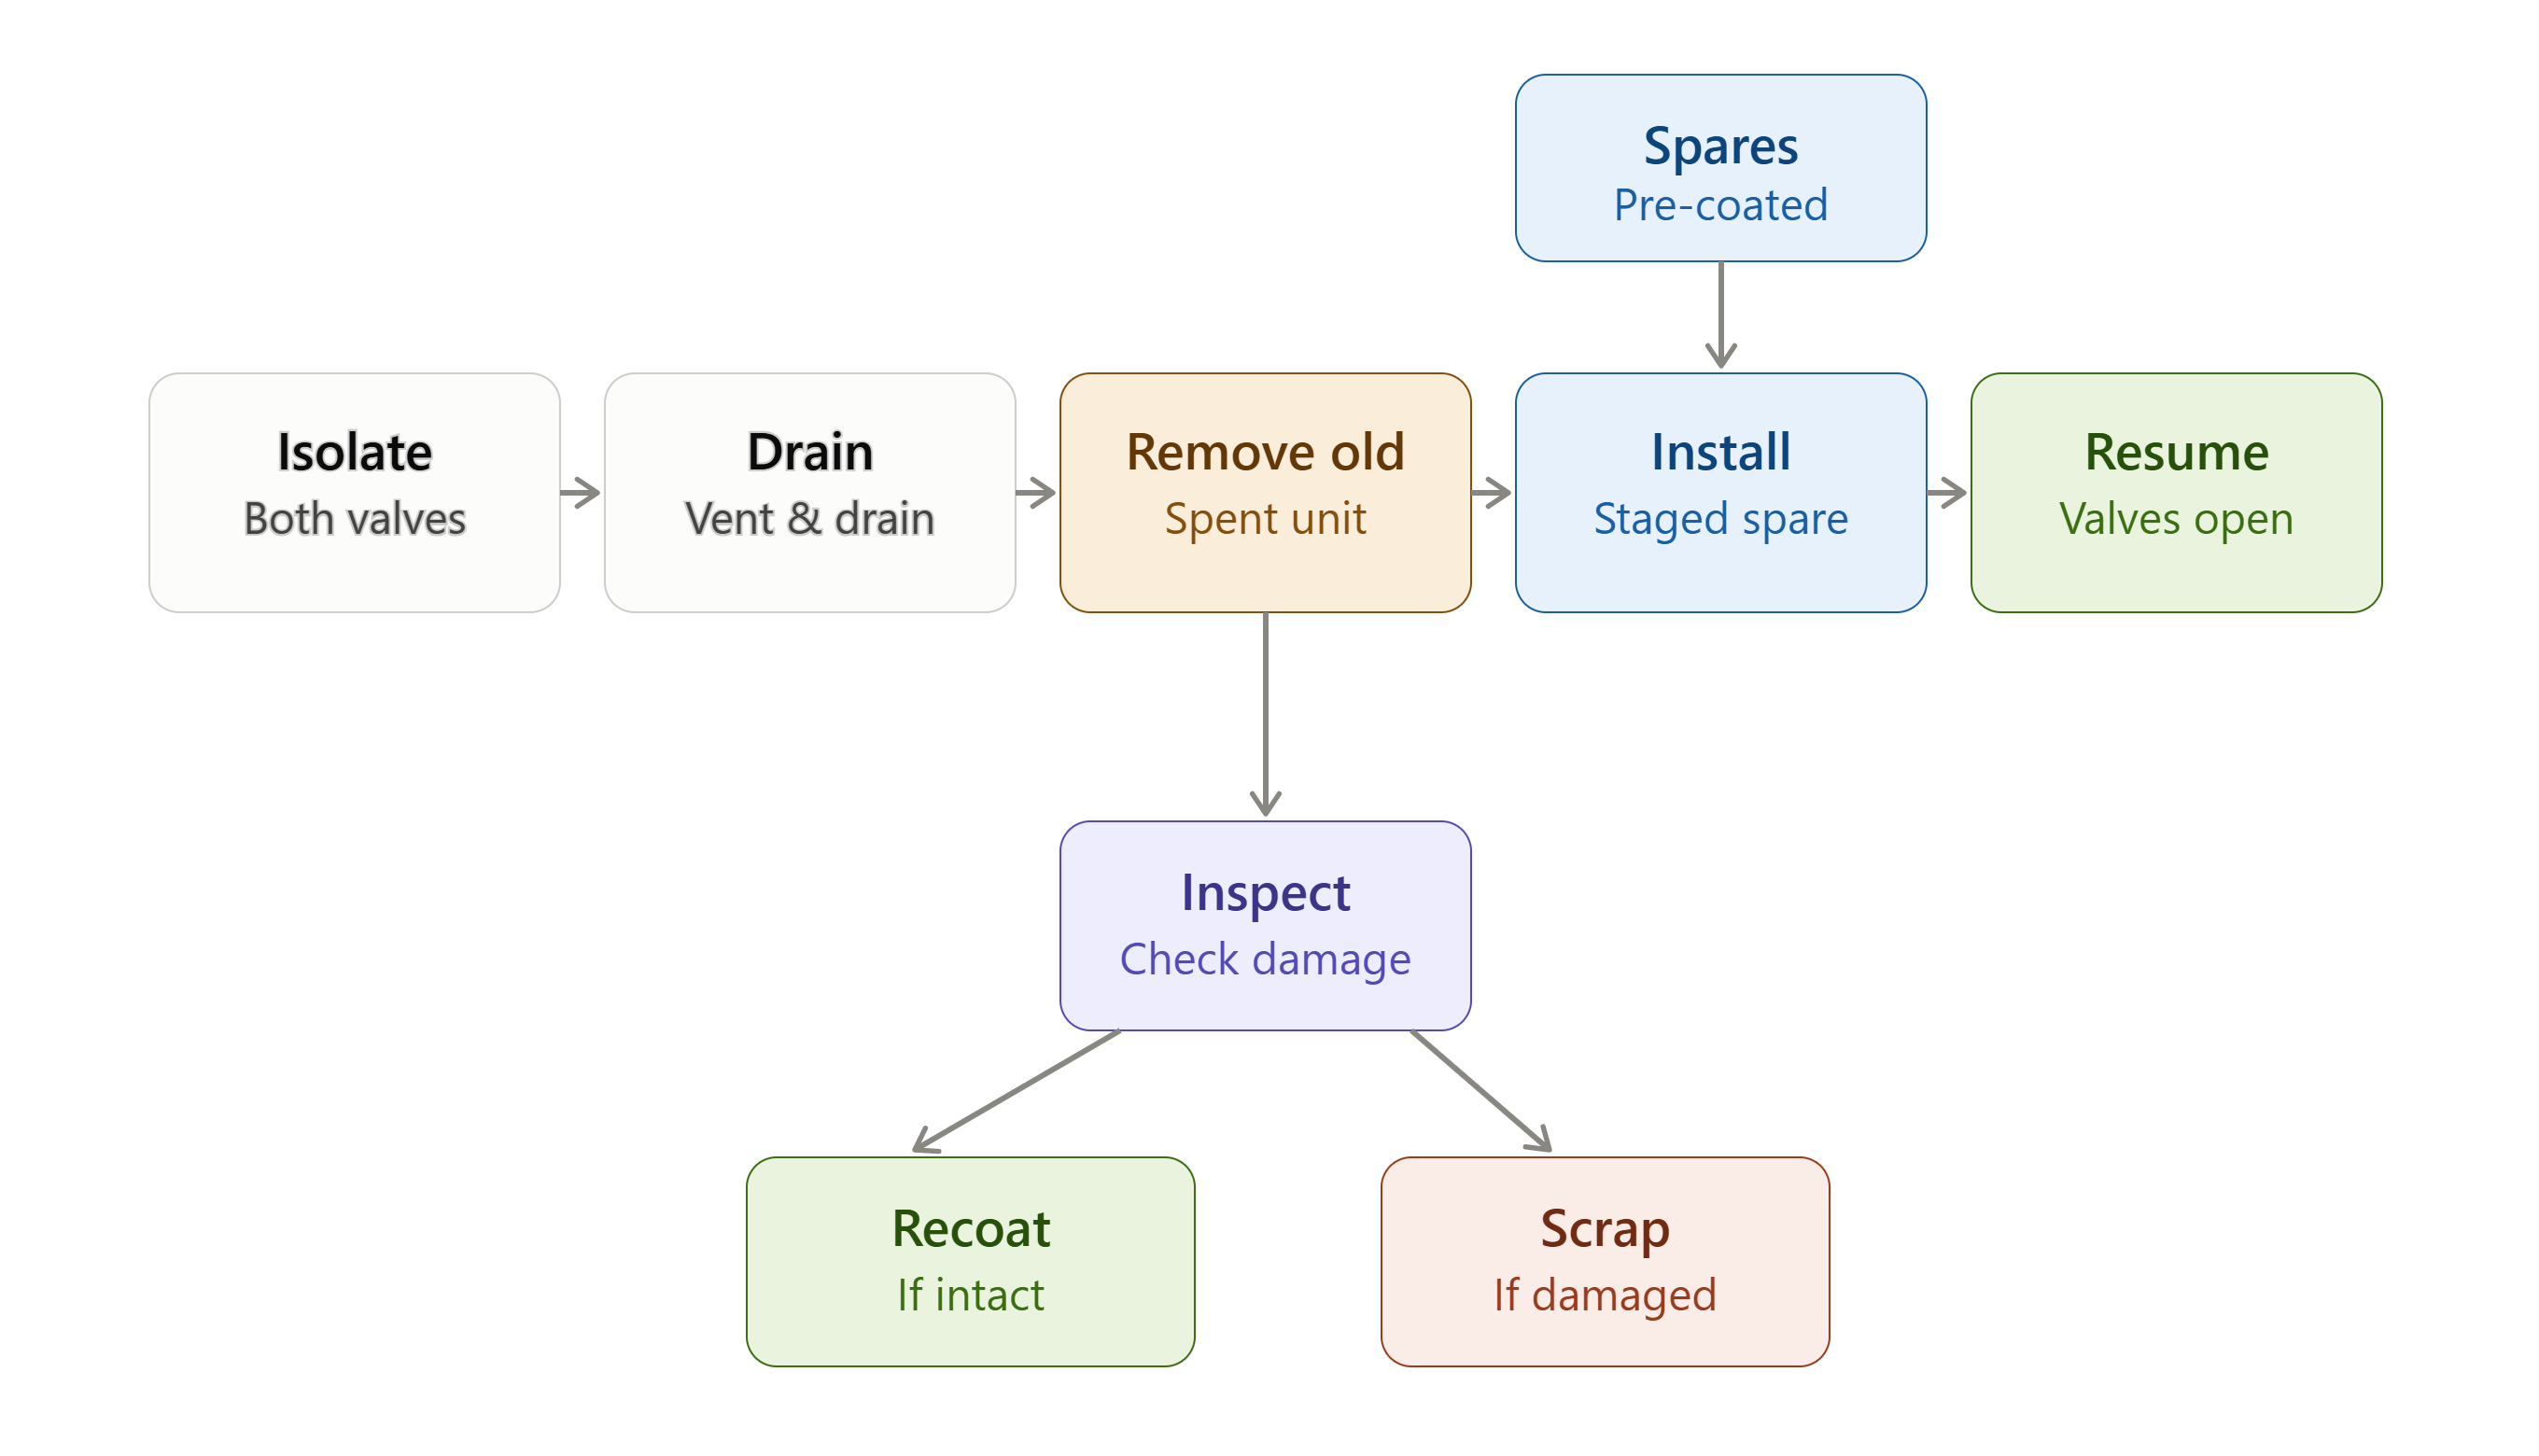
Lower upfront cost per unit area. Coating depletion failure mode. Often refurbishable by re-coating if caught before substrate passivation.
Boron-doped diamond (BDD) electrode are with a higher upfront cost per unit area, generally longer service life. Failure mode is delamination rather than gradual depletion. Refurbishment options are more limited.
Common Electrode Management Mistakes
Two electrodes at different duty cycles will show very different real degradation at the same calendar age. Ah/cm2 tracking gives a comparable, predictive number across varying operating conditions.
Without a threshold set during commissioning, voltage rise gets normalized as “the process getting harder” until a spike forces an unplanned shutdown.
The throughput gain is real but so is the non-linear life reduction. Model the tradeoff explicitly rather than defaulting to the highest current density the rectifier can deliver.
Emergency procurement after a failure typically costs more and causes more downtime than holding spares sized to the plant’s measured Ah/cm² consumption rate.
Where does this take you next?
Electrode life drives both OPEX and downtime risk. Where you go next depends on where you are in the decision.
Ready to budget replacement
Fold electrode amortization into a full levelized cost model.
Need a real life estimate
Electrode screening on your actual matrix is part of a standard pilot test.
Reconsidering current density
Life and energy cost trade off directly — check the energy-side lever first.
Build an electrode replacement budget you can defend
Send us your current density, duty cycle, and chloride levels and we will help you model realistic Ah/cm² life and a spares strategy.